Issue 6
|
July - September 2016
|

Our Purpose: To identify excellent Florida freshwater fishing opportunities and to provide anglers with relevant information that will enhance the quality of their outdoor experience.
If you reached this newsletter through a website link instead of receiving it by email, you can subscribe free at the Subscription Topics page under "Freshwater Fishing".
Having trouble viewing this email? View it as a Web page.
|
TrophyCatch Tracker
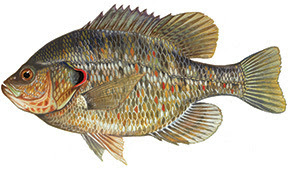
Featured Fish: Redear Sunfish (Shellcracker)
Angling qualities: This popular sportfish is the largest of our bream and fights well on light tackle. Live worms, crickets and grass shrimp make excellent baits. Lure anglers should use small jigs, beetle spins or spinners. Fly anglers can use almost any wet fly or nymph, although a small popping bug remains the perennial favorite. Redears may be found spawning throughout the spring and summer well into August, and locating a group of beds can lead to some fast and steady action. This fish also goes by the name of “shellcracker,” due to its preference for small snails and clams (and more specifically, the hard plates in the back of its mouth used for breaking open these delicacies). Its feeding habits make it likely to be found somewhat deeper and closer to the bottom than other species.
Where to catch them: Redear sunfish are abundant throughout Florida, but some of the best locales include Lake Kissimmee, West Lake Tohopekaliga, Lake Istokpoga, Lake Panasoffkee, the Winter Haven South Chain of Lakes, Mosaic Fish Management Area, Lake Okeechobeeand Everglades Water Conservation Areas 2 & 3.
Fisheries Biology: Understanding Length Frequency
Most readers are aware of the new black bass rules that are now in effect throughout Floridabeginning July 1, 2016 (see Issue 5 for details). These rules were developed with a tremendous amount of public involvement and decades of research on the effectiveness of various regulations.
Data from hundreds of fish population samples were also considered in creating these new black bass regulations. One of the most important components of this data used to establish statewide size limits is length frequency, which is the size distribution of fish within a population. This information is vital to determining what size fish can be harvested with the least impact on the population.
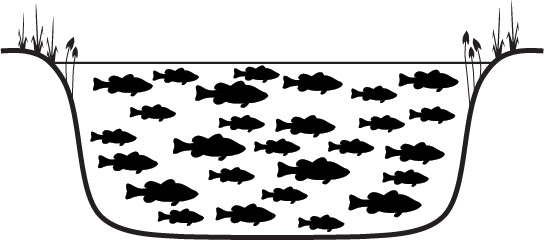
How do FWC biologists obtain length frequency data from a fish population? Well, it starts with the fish! The illustrations below show a simplified version of how a length frequency graph is created and how that data contributes to establishing sound fishing regulations.
1. Above is a lake full of largemouth bass. As you can see, there are many different sizes. Of course, there are also sunfish, crappie, catfish and other species in the lake, but to manage bass it helps to look specifically at the length frequency of the bass.
2. Fisheries biologists sample the bass in the lake. There are various sampling methods that can be used, but electrofishing is one of the most efficient and also allows the fish to be caught, measured and then released unharmed (see "Shocking Truths of Electrofishing" at theFlorida Sportsman FWC Freshwater Blog). Biologists can essentially "capture" the fish from the lake, but in the form of data -- the numbers go back to the lab, but the fish go back in the water!
3. Back at the lab, biologists sort the fish (actually, the fish data) by size category. The example above illustrates this process as if the actual fish, rather than the data, have been sorted. Commonly used size categories are increments of 1 cm (0.4 inches) and 2 cm (0.8 inches), but in our simplified example we're going to use large 2-inch size groups. As you can see, this fish population has more 10-inch category bass than any other size group. You can also see that the fewest bass in the population are in the 16- and 18-inch size groups.
4. Of course, biologists don't use fish symbols. They use the bass length data to create alength frequency graph. This is how biologists are trained to look at fish population size distributions, and gives a better visual picture of the different sizes of fish in a bass population.
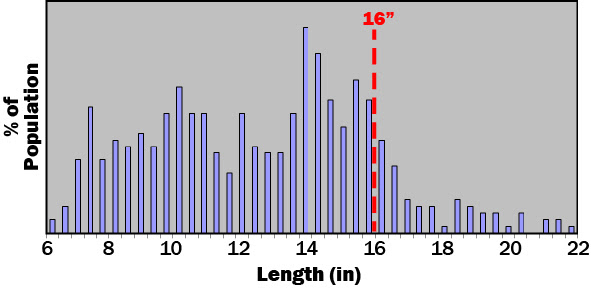
Those are the steps in creating a length frequency graph for a bass population. Above is an authentic graph generated from actual sampling data. These bass size distributions will vary from waterbody to waterbody, and also within the same water over time (especially following events such as a very good spawning year or a devastating drought). However, this graph is very typical of most Florida waters in that the vast majority of largemouth bass are less than 16 inches long. This is a good example of why the new statewide regulation for largemouth bass is "5 Black bass, only one of which may be 16 inches or longer in total length." With an abundance of smaller bass, you can also see why there is often no need for a minimum length limit.
The goals of the new statewide bass rules are to streamline regulations, allow anglers to keep smaller, more abundant bass, and protect larger bass desired by most anglers. Length frequency information helps FWC biologists determine which regulations are appropriate for the most enjoyment and best conservation of Florida's bass.
New State Record Shoal Bass
Featured Locale: Saddle Creek Park Fish Management Area (Polk County)
To contact the Florida Freshwater Angler, email John Cimbaro.
|
http://live.oysterradio.com/





No comments:
Post a Comment